
.png)
.png)

Smart way to get insights for the city’s public transportation mobility
Cermoni is a big data-driven decision support system that offers planning & optimization, analysis, and data management processes under one roof in public transportation. It addresses many of your questions such as "How do public transportation users move around the city? How can I create schedules, vehicle, and driver assignments that reduce costs and improve service levels?"

We provide multimodal mobility insights in operational, tactical and strategic levels (travel demand analysis, origin-destination analysis, congestion index, queue dynamics, traffic flow, etc.) for future plans by using different mobility data input sources like vehicle, public transportation and location based services.
_edited_ed.png)
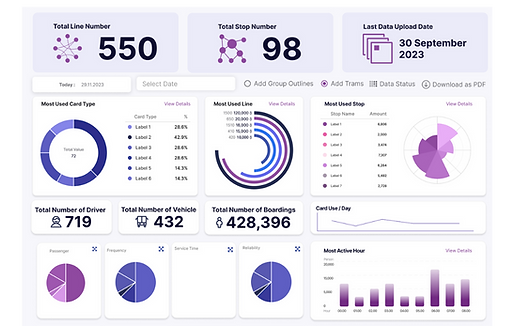
Cermoni provides performance analyses of the current situation based on routes, stops, and zones (such as the number of boardings, route similarity ratios, etc.). Additionally, it offers demand and behavior analysis in public transportation through Origin-Destination analyses.
Analysis
By turning accident related data like accident type, location, road users, infrastructure, weather, etc. into actionable insights (road safety ranking, hotspot analysis, relations with traffic data, etc.) more accurate data-based decisions are enabled.
_edited_ed.png)
With its dynamic and innovative planning approach that allows you to test different scenarios, Cermoni creates optimized schedules and assigns vehicles and drivers to meet public transportation demand while catering to your needs (such as cost reduction, service level improvement, etc.)
Planning &
Optimization
By using different data inputs like road side sensors, traveler data, road closures, etc. the more effective, real-time traffic management is provided with comprehensive solutions like dynamic junction management,
integrated corridor management, real-time traffic density and traffic estimation, etc.
_edited_ed.png)
Cermoni ensures the management of your public transportation data is up-to-date and accurate by converting it to the international data standard GTFS format. Additionally, this format allows for data sharing with passenger information applications, providing users with accurate and current public transportation information.
Data Management
(GTFS)
Cermoni offers multiple improvements to evaluate the public transport system

Scenario-Based Timetable Planning
Cermoni lets you evaluate metrics like vehicle numbers, fuel consumption, and carbon emissions across varying occupancy rates and service levels. Seamlessly integrating passenger travel demand variability into timetable planning, we ensure precise scheduling tailored to real-world conditions.
Vehicle and Driver Assignment
Assign vehicles in your fleet to create the perfect timetable, ensuring smooth operations. Make driver assignments and maintain work-life balance by setting your own constraints, such as working hours and break times.

.png)
Dead KM Optimization
By minimizing empty vehicle movements, you can reduce fuel consumption, operational costs and environmental impacts. Thanks to Cermoni's optimization tools, minimize dead kilometers and increase your fleet efficiency by routing your vehicles in the most efficient way.
Electricle Vehicle Optimization
Cermoni's advanced tools help you monitor battery levels, optimize charging scheduling and extend vehicle range while minimizing operational disruptions. Reduce carbon emissions with electric vehicles, reduce costs and create a smarter, sustainable public transport.
.png)
.png)
Origin-Destination Analysis
Cermoni keeps an eye on boardings, transfers, and routes to perform detailed origin-destination analyses. Our predictive models reveal insights that enhance regional transit efficiency. Get ready to transform your public transport experience!
Data Management (GTFS)
Your information stays securely digitized in the universal GTFS format, making it easy to integrate and access from any platform. Plus, with versioning, you can track changes and maintain a clear record of all updates for enhanced transparency and accountability.


.png)

.png)
How does Vignola plan public transport with Cermoni in compliance with the 30 km speed limit regulations? With fewer vehicles and better service!
Success Story of Modena,Italy
.png)
Parabol optimizes public transportation in Burulaş with the Cermoni Public Transportation Decision Support System!